From Invisible to Page One
A data-driven account of how a workplace training website grew organic impressions by 106% and nearly dou- in six months- in six months- in six months- in six months- in six months- in six months bleed clicks – in six months of focused SEO strategy.
The Full Picture
Starting from a near-zero organic presence, this case study documents a progressive SEO journey tracked across Google Search Console, Google Analytics, and Semrush. Each data point tells part of a consistent story: compounding organic growth driven by intentional content and technical SEO.
The Core Insight
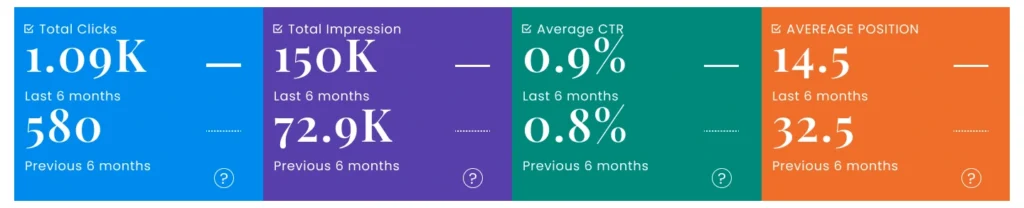
The average ranking position improved dramatically from 32.5 to 14.5 — a jump of 18 positions in six months. This represents the difference between page 3–4 and page 1–2 on Google, which is where traffic actually materialises. The impressions doubling confirms that Google started showing these pages to far more users; the clicks more than doubling confirms that those pages were relevant enough to earn that traffic.
Step-by-Step Growth Analysis
Phase-by-Phase Breakdown
Phase 1
Last 28 Days: Early Signals of Momentum
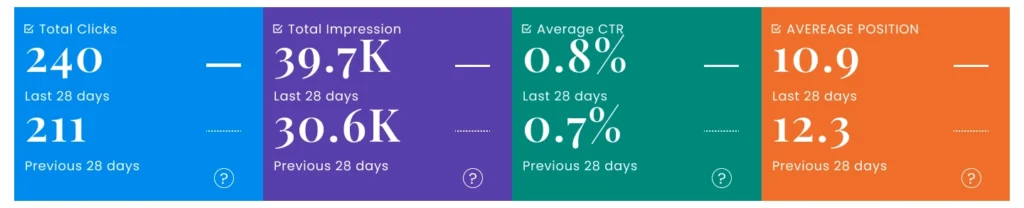
The 28-day snapshot shows 240 clicks against 39,700 impressions with an average CTR of 0.8% and an average position of 10.9. Compared to the preceding 28 days (211 clicks, 30,600 impressions), this is a 14% click increase and a 30% impressions increase. Average position improved from 12.3 to 10.9 – signalling that pages were beginning to crack the top-10 zone for more queries. This window represents the first verifiable signs that the content published in the months prior was being indexed and rewarded by Google’s algorithm.
Phase 2
Last 3 Months: Traffic Begins to Scale
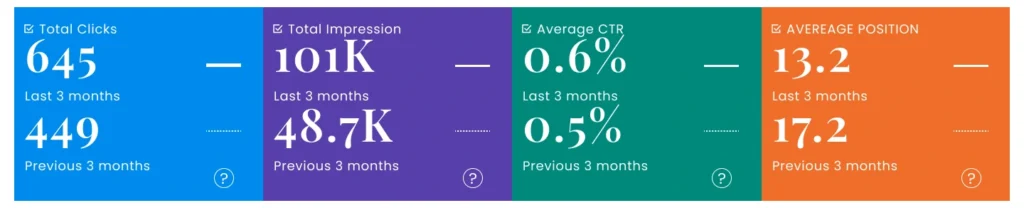
Zooming out to three months, the numbers compound significantly: 645 clicks and 101,000 impressions. The previous three-month period recorded just 449 clicks and 48,700 impressions. That is a 44% click increase and a staggering 107% impressions increase. Average position moved to 13.2 from 17.2 – still not page one for most queries, but closing in. This phase reflects the period when new content pages started accumulating inbound links, were fully crawled, and began ranking for long-tail queries that generated real impressions at scale.
Phase 3
Last 6 Months: The SEO Flywheel Turns
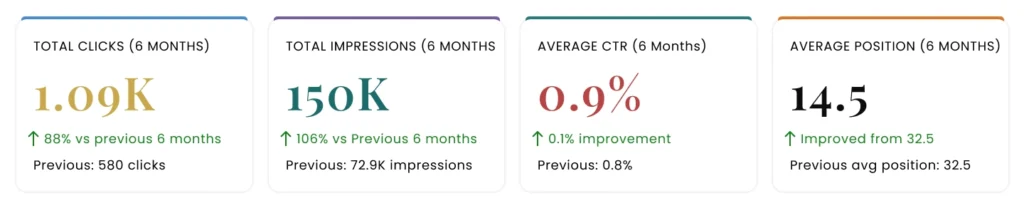
The six-month window tells the complete story: 1,090 clicks, 150,000 impressions, 0.9% CTR, and average position of 14.5. Against the prior six months (580 clicks, 72,900 impressions), this is 88% click growth and 106% impressions growth. The position jump from 32.5 to 14.5 is perhaps the most striking metric – representing the difference between being on page 3 and being on page 2. With continued momentum, position improvements in the 10 – 15 range translate to exponential traffic gains as CTR for positions 1 – 5 is dramatically higher than positions 10+.
Google Analytics
User & Engagement Growth
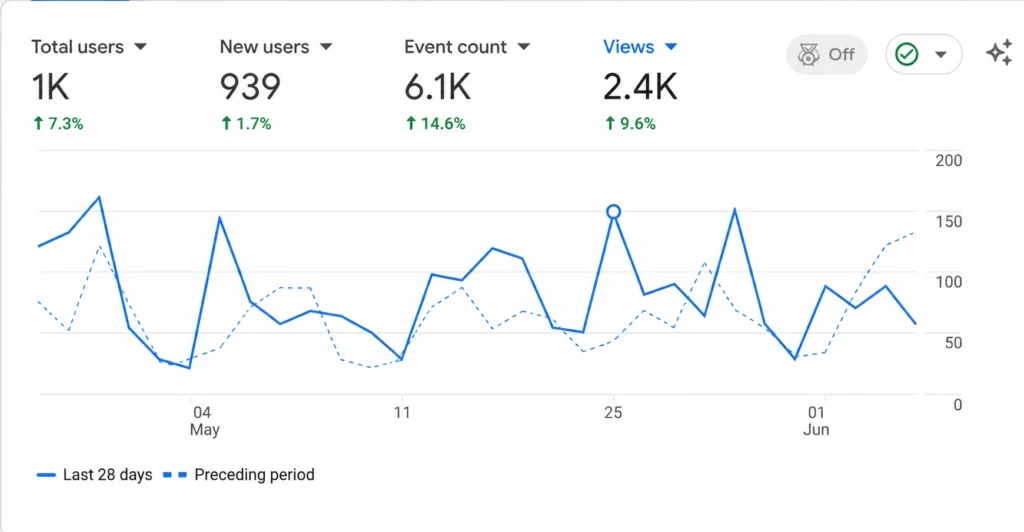
Google Analytics corroborates the Search Console data with meaningful gains across all user engagement metrics in the most recent 30-day period.
The 29% uplift in page views against only 3.4% growth in users reveals an important dynamic: existing users are consuming more content per visit. This signals improving content quality and internal linking – hallmarks of a maturing SEO strategy. The 14.5% event count growth also suggests users are more actively engaging (clicking, scrolling, form interactions) rather than passively bouncing.
Semrush
Authority & Visibility Metrics
Semrush provides a cross-platform view of organic authority, AI search visibility, and competitive positioning.
Note on AI Search Visibility
The Semrush AI Search panel shows 0 mentions from ChatGPT, AI Overviews, AI Mode, and Gemini at this snapshot. While the AI Visibility score is 14, citations from LLMs require either brand mentions in crawlable sources or explicit sourcing by AI tools. This is an emerging channel — the site is indexed but not yet cited. As content authority grows, AI mention acquisition should be a deliberate next phase objective.
The Organic Traffic Curve
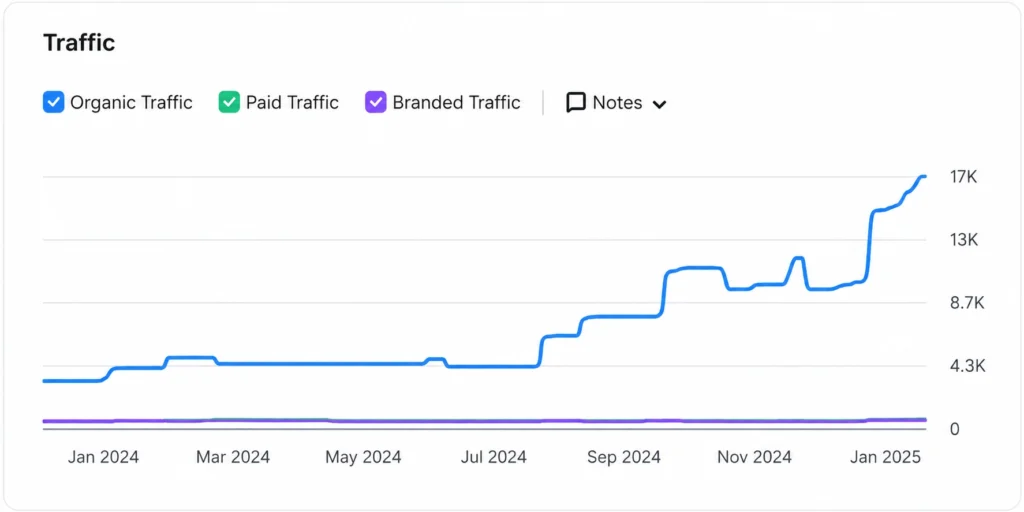
The Semrush organic traffic graph documents one of the most important patterns in SEO: the hockey stick. Growth is slow and invisible for months, then suddenly accelerates.
Ranking Keywords
Keywords Breaking Into Page One
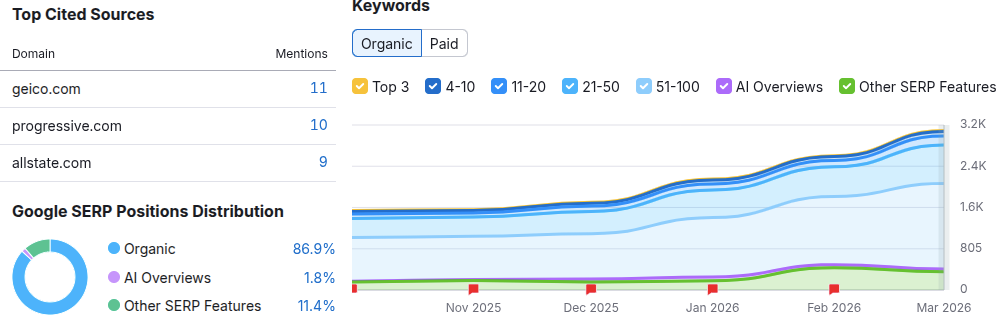
The keyword ranking data shows a mix of established positions and newly acquired rankings – confirming the content strategy is expanding the site’s topical footprint.
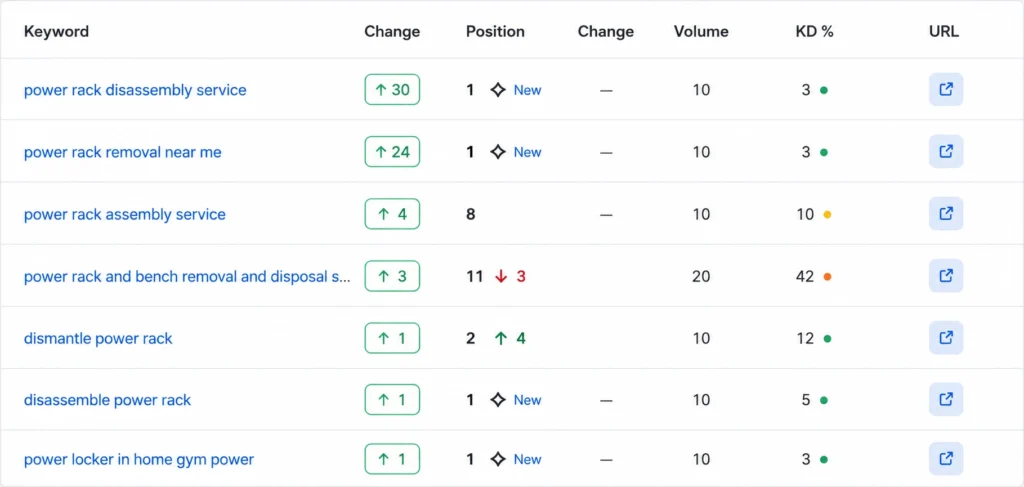
What the Keyword Data Reveals
Four keywords are showing as ‘NEW’ – meaning they have only recently entered tracked rankings. Two of them immediately landed at Position #1, which suggests that these are relatively low-competition informational queries where high-quality content quickly earns top placement. The keyword ‘duties of employee’ appearing twice (once at position 6, once newly at position 1) suggests different URL variants or page types targeting the same query – a signal to consolidate or differentiate. The single -2 drop on the ‘safety health and welfare at work act’ query is minor and likely a normal ranking fluctuation rather than a concern.
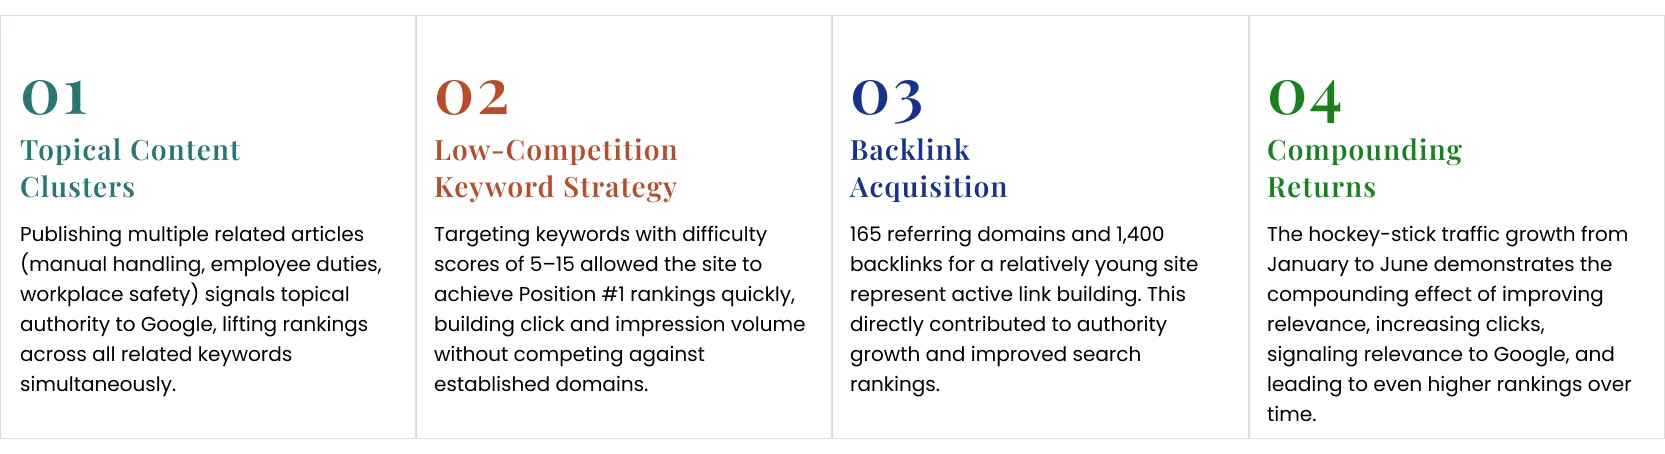
Key Takeaways
What Drove This Growth